A Shared or Matching Segment is a DNA segment in a particular chromosome that is considered the same in two different testers. It could be of any size including the whole chromosome. Shared Segments are only derived for the autosomes and xDNA. Test companies and 3rd Party tools use the RAW results of SNP values derived from DNA testing to determine Shared Segments. While looking at the detailed overlap of matching segments from multiple testers is the best way to determine the common ancestor, most use a much simpler analysis of match lists which contain summary values.

Matching Segments can be presented in a tabular form as the chromosome identifier, starting and ending base-pair locations, and often a matching segment length given in cM. They can also be presented in a graphical form as depicted in the chart to the right with each chromosome roughly identified and matching segments between two testers given as a colored bar overlaid on a portion of the chromosome.
You usually have two copies of each chromosome (except X and Y in males), so the match could come from either copy. And in fact, which copy the matching segment is from is often not determinable in half-identical match tools.
Cross-over events tend to break up a chromosome in arbitrary places as the DNA strands are passed down to two individuals from a common ancestor. So even full siblings may have non-overlapping or even partially overlapping matching segments with the same tester.
Most matching algorithms in Genetic Genealogy will use a minimum of 500 to 700 SNP's that match, in sequence, to define a matching segment. This assumes they have tested 600,000 or more SNPs across the autosomes and thus, roughly, on average, one of every 5,000 base-pairs. Note that each SNP has two values; one for each chromosome of the pair. They also define how many un-matching SNPs can be in a row or close-by before you consider the segment terminated and unmatched. This is needed because SNP values are sometimes in-determinable in a given person's test (blank or no-call); not properly tested (incorrect value), or not tested at all (untested). Often 10's to 100's of SNP's have to mismatch before it is considered no longer a match and the matching segment is terminated. Matching segment length is often reported in centiMorgans. But the start and stop point of the matching segment in the chromosome is reported as a base-pair count determined from an underlying reference model of where the SNPs reside in the chromosome.
Matching segments must be determined by all half identical match analysis tools. The RAW data returned from the test companies is reported as un-ordered pairs of values for each SNP measured; one value from each chromosome of the pair for the autosomes (and possibly X in a biological female). Testing companies aggressively report longer matching segments than may actually exist. This partly because the matching algorithms use either value of the un-ordered pair of values returned from testing and work to always make a match. This is why it is best to do matching with phased results, if possible. For siblings that you wish to compare to each other, you can only get accurate (as opposed to nonsense) matching segment values from phased comparison matching or by doing full identical analysis. This requirement is there if endogamy exists between any two testers (that is, anytime there are full identical regions between two testers). Generally though, if you have phased results, you have the parent tested. And so you want to use the parents results (which are un-phased) in the analysis of other potential matches instead of the child's. A parent will always have as much but usually much more matching segments with another tester than the child; if the other tester is related through that parent. So a bit of a catch-22 situation.
A little known fact when comparing results, especially from different test companies, is that there may be little overlap of the tested SNPs. Matching algorithms tend to always err on the side of matching. So if a sequence of 100 SNPs exist in each tester, for example, but none of the SNPs tested are in common, then the sequence may be considered a match even though no significant matching values are found. As with much of biology in general, determining matches from the testing data is not an exacting science. There is a lot of art and tuning to properly determine and report matching segments; especially from different test companies.
In genetic genealogy, the closer two people are to a common ancestor (the measure of Consanguinity or relatedness), then:
While finding all shared segments is the basis for comparing any two atxDNA test results, we often do not view the shared segments directly. Various levels of analysis or simplification exist depending on what the level of matching you care about at any given time. See our tutorial on Autosomal Match Analysis for a better explanation of how shared segments are viewed either discretely or clumped and summarized.
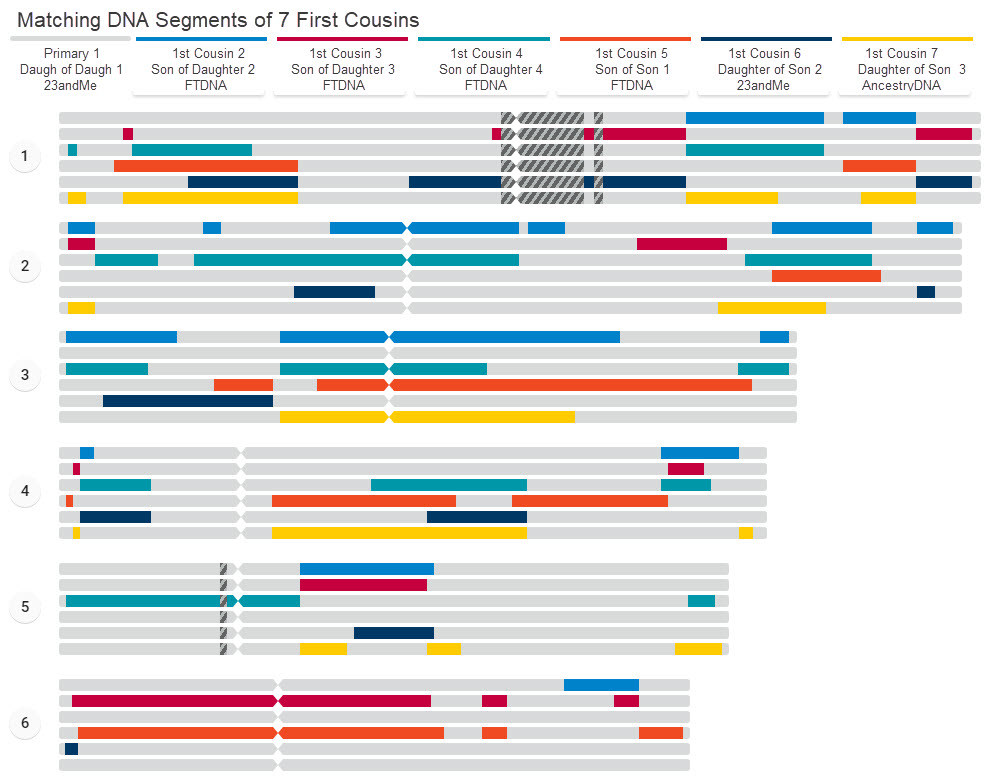
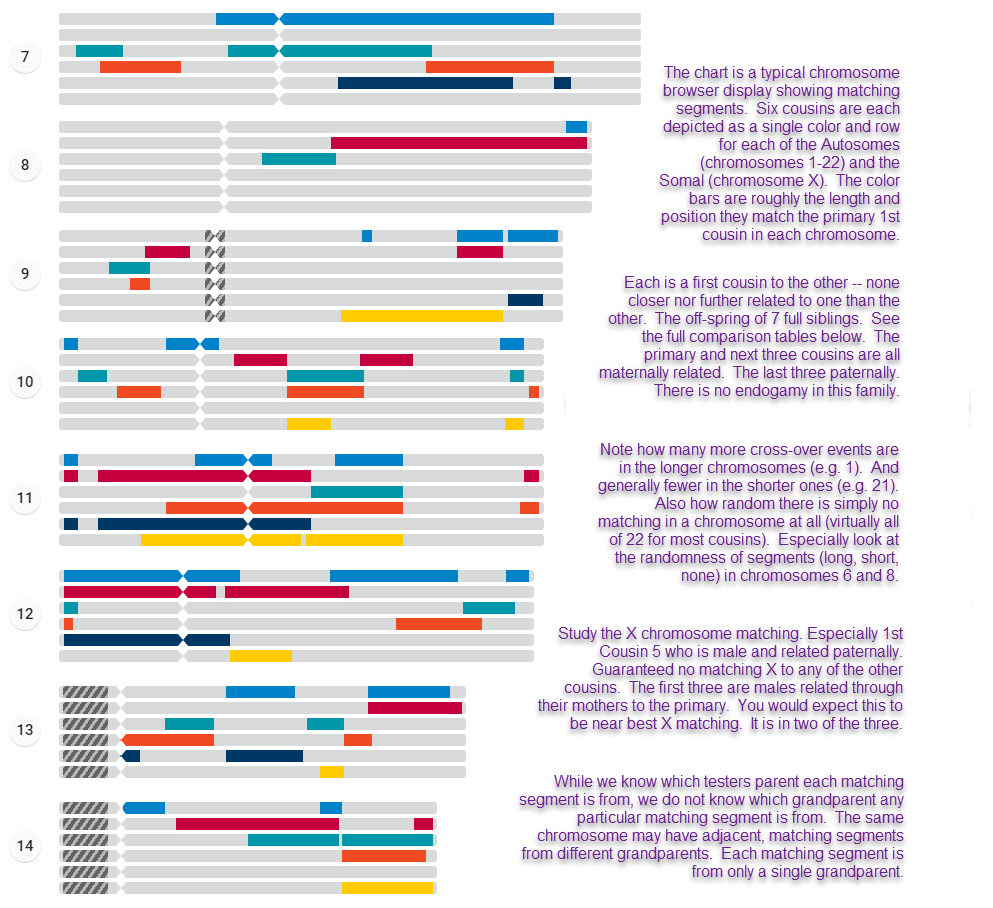
We purposely broke-up the chart into three panels so it is easier to view via the webpage. For an unbroken form you can print as a whole, visit the segment matching page.
This 7-cousin chart and the earlier on on this page are examples of Chromosome Painting.
Shared Segment Determination
Determining shared segments is the first step in any match analysis between two testers by a test company or tool. In Genetic Genealogy, the autosomal test returns SNP genetic marker values and not an actual full-sequence of base-pairs from the DNA strand of each tester. The idea here is if you have a sequence of matching SNP's, then you likely have an underlying sequence of matching base-pairs within the portion of DNA defined by that sequence. The key is having frequent enough SNP's tested in a chromosome to capture an accurate, possible matching segment of base-pairs. The matching segment length is determined by the first and last matching SNP in a long sequence of matching SNPs. The SNP location in the reference model is determined as the number of base-pairs from the end of the chromosome. Each SNP location is determined and ordered in the chromosome. Then the tool checks the values of that SNP in each tester to see if they match. The length of the matching segment is thus the difference in the base-pair positions of the first and last of a matching SNP sequence. The base-pair count (or length) is then often converted into a cM value and associated with that matched segment. So a shared segment in a chromosome is defined by a start and end base-pair position as well as a length in cMs.Shared Segment Graph and Table
(Example taken from 23andMe)
(Example taken from 23andMe)
You usually have two copies of each chromosome (except X and Y in males), so the match could come from either copy. And in fact, which copy the matching segment is from is often not determinable in half-identical match tools.
Cross-over events tend to break up a chromosome in arbitrary places as the DNA strands are passed down to two individuals from a common ancestor. So even full siblings may have non-overlapping or even partially overlapping matching segments with the same tester.
Most matching algorithms in Genetic Genealogy will use a minimum of 500 to 700 SNP's that match, in sequence, to define a matching segment. This assumes they have tested 600,000 or more SNPs across the autosomes and thus, roughly, on average, one of every 5,000 base-pairs. Note that each SNP has two values; one for each chromosome of the pair. They also define how many un-matching SNPs can be in a row or close-by before you consider the segment terminated and unmatched. This is needed because SNP values are sometimes in-determinable in a given person's test (blank or no-call); not properly tested (incorrect value), or not tested at all (untested). Often 10's to 100's of SNP's have to mismatch before it is considered no longer a match and the matching segment is terminated. Matching segment length is often reported in centiMorgans. But the start and stop point of the matching segment in the chromosome is reported as a base-pair count determined from an underlying reference model of where the SNPs reside in the chromosome.
Comparing 1st Cousins
(broken into 3 panes for easy viewing)
(broken into 3 panes for easy viewing)
A little known fact when comparing results, especially from different test companies, is that there may be little overlap of the tested SNPs. Matching algorithms tend to always err on the side of matching. So if a sequence of 100 SNPs exist in each tester, for example, but none of the SNPs tested are in common, then the sequence may be considered a match even though no significant matching values are found. As with much of biology in general, determining matches from the testing data is not an exacting science. There is a lot of art and tuning to properly determine and report matching segments; especially from different test companies.
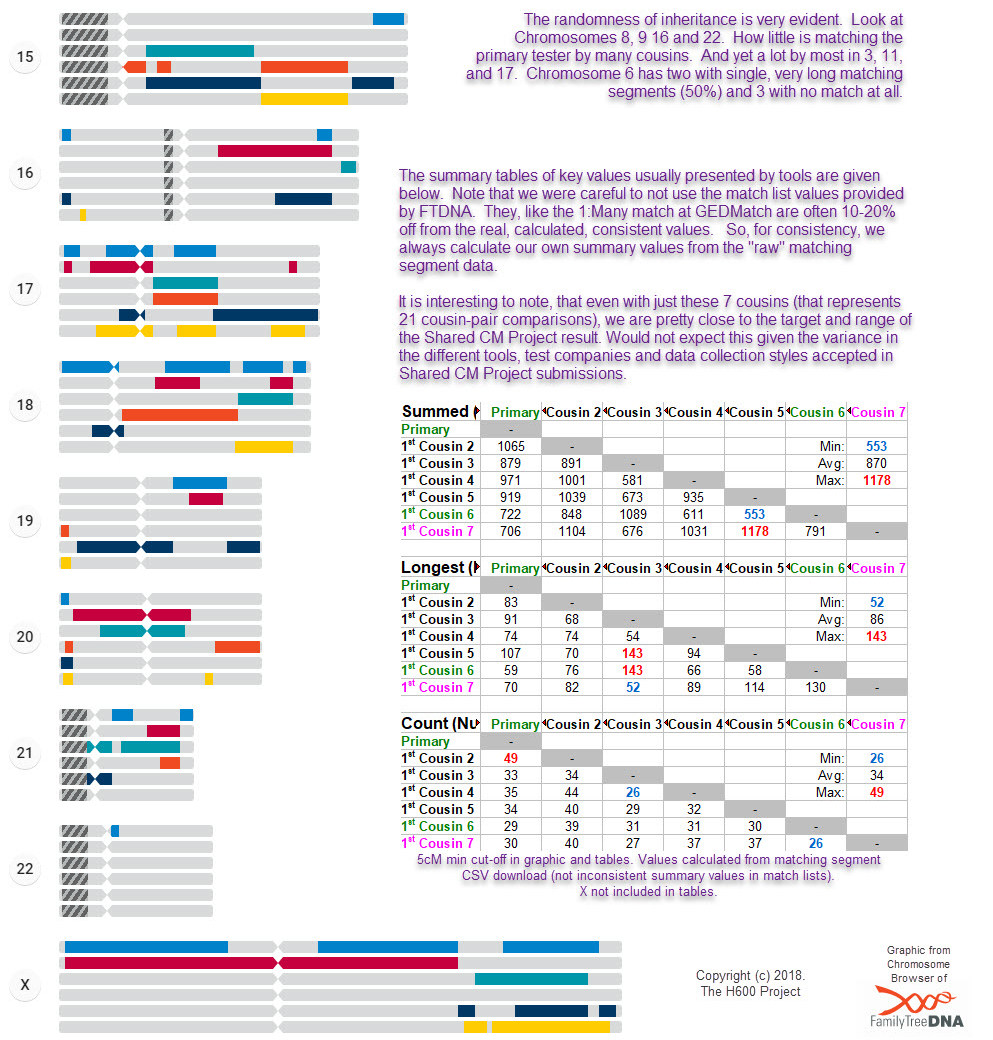
Summary Values from Shared Segments
These derived Shared Segments, with certain cut-offs applied to assure valid results, are summed in various ways to then annotate match lists. The common values extracted from the list of matching segments between two testers are:- the Total Matching Segments (an amount, either reported as a percentage of all your DNA or in cM; with roughly 72 cM equal to 1%),
- the Number of Matching Segments (a count), and
- the Largest Matching Segment (length, in cM).
In genetic genealogy, the closer two people are to a common ancestor (the measure of Consanguinity or relatedness), then:
- the longer the matching segments,
- the more matching segments that exist1, and
- the larger the amount of total matching segment length as a percentage of the total DNA (that is, the Total Matching Segment amount)
While finding all shared segments is the basis for comparing any two atxDNA test results, we often do not view the shared segments directly. Various levels of analysis or simplification exist depending on what the level of matching you care about at any given time. See our tutorial on Autosomal Match Analysis for a better explanation of how shared segments are viewed either discretely or clumped and summarized.
Example of 7 Cousins Compared
With that said, to the right is a sample chromosome browser chart comparing a primary / target tester with 6 others. The colored bars are showing the matching segments between the primary and the indicated tester. Grey are no-match areas. The inheritance of DNA and even matching segments is varied across the different chromosomes and dependent on the length of the chromosome and maybe whether the tester and their ancestors were male or female (in the case of xDNA matching segments). This particular chart is comparing 7 first cousins — they are each a first cousin to each other. A similar chart can be made taking anyone of them as the primary to compare against. But it will result in different results as what each cousin shares with another is different. These cousins all share two grandparents (each cousin has one parent that is a full-sibling to the one of the other cousins' parents). So it is not clear from this chart which of the two grandparents contributed the matching segment.We purposely broke-up the chart into three panels so it is easier to view via the webpage. For an unbroken form you can print as a whole, visit the segment matching page.
This 7-cousin chart and the earlier on on this page are examples of Chromosome Painting.
External Links
- Dr. Daphne Weissglas-Volkov presentation at MyHeritage Live in Fall 2018 — as captured and summarized by Roberta Estes in her blog — covers many of the gory details in developing shared segments